Graphite Metrics are one of the most common metrics formats in application monitoring today. Originally designed in 2006 by Chris Davis at Orbitz and open-sourced in 2008, Graphite itself is a monitoring tool now used by many organizations both large and small. It accepts metrics from a wide variety of sources, including popular daemons like collectd and statsd, provided that the metrics are sent in the following simple format:

Where metric path is a unique identifier, specified in a dot-delimited format. Implicit in this format is also some logical hierarchy specific to each environment, for example:

While this hierarchical format has been widely accepted in the industry for years, it creates challenges for usability and ultimately lengthens the time to troubleshoot application issues. Users need to carefully plan and define these hierarchies ahead of time in order to maintain consistency across systems, scale monitoring effectively in the future and reduce confusion for the end user leveraging these metrics. Fortunately, the industry is evolving towards tag-based metrics to make it easier to design and scale these systems, and Sumo Logic is excited to announce the launch of Metrics Rules to take advantage of this new model immediately.
Using Metrics Rules to Bring Graphite Metrics into the New World
Sumo Logic built its metrics platform to support metadata-rich metrics, but we also acknowledged that the broader industry and many of our customers have invested heavily in their Graphite architecture and naming schemas over time. Sumo Logic’s Metrics Rules solution now allows users to easily transform these Graphite metrics into the next generation, tag-based metric format, which provides three key benefits:
- Faster Time to Value: No need to re-instrument application metrics to take advantage of this metadata-rich, multi-dimensional format. Send Graphite-formatted metrics to Sumo immediately and enrich them with tag-based metadata later.
- Easy Configuration: An intuitive user interface (UI) allows you to validate and edit your transformation rules in real-time, while competitive solutions require carefully defined config files that are difficult to set up and prone to errors.
- Improved Usability: With rich metadata, use simple key-value pairs to discover, visualize, filter and alert on metrics without knowing the original Graphite-based hierarchy.
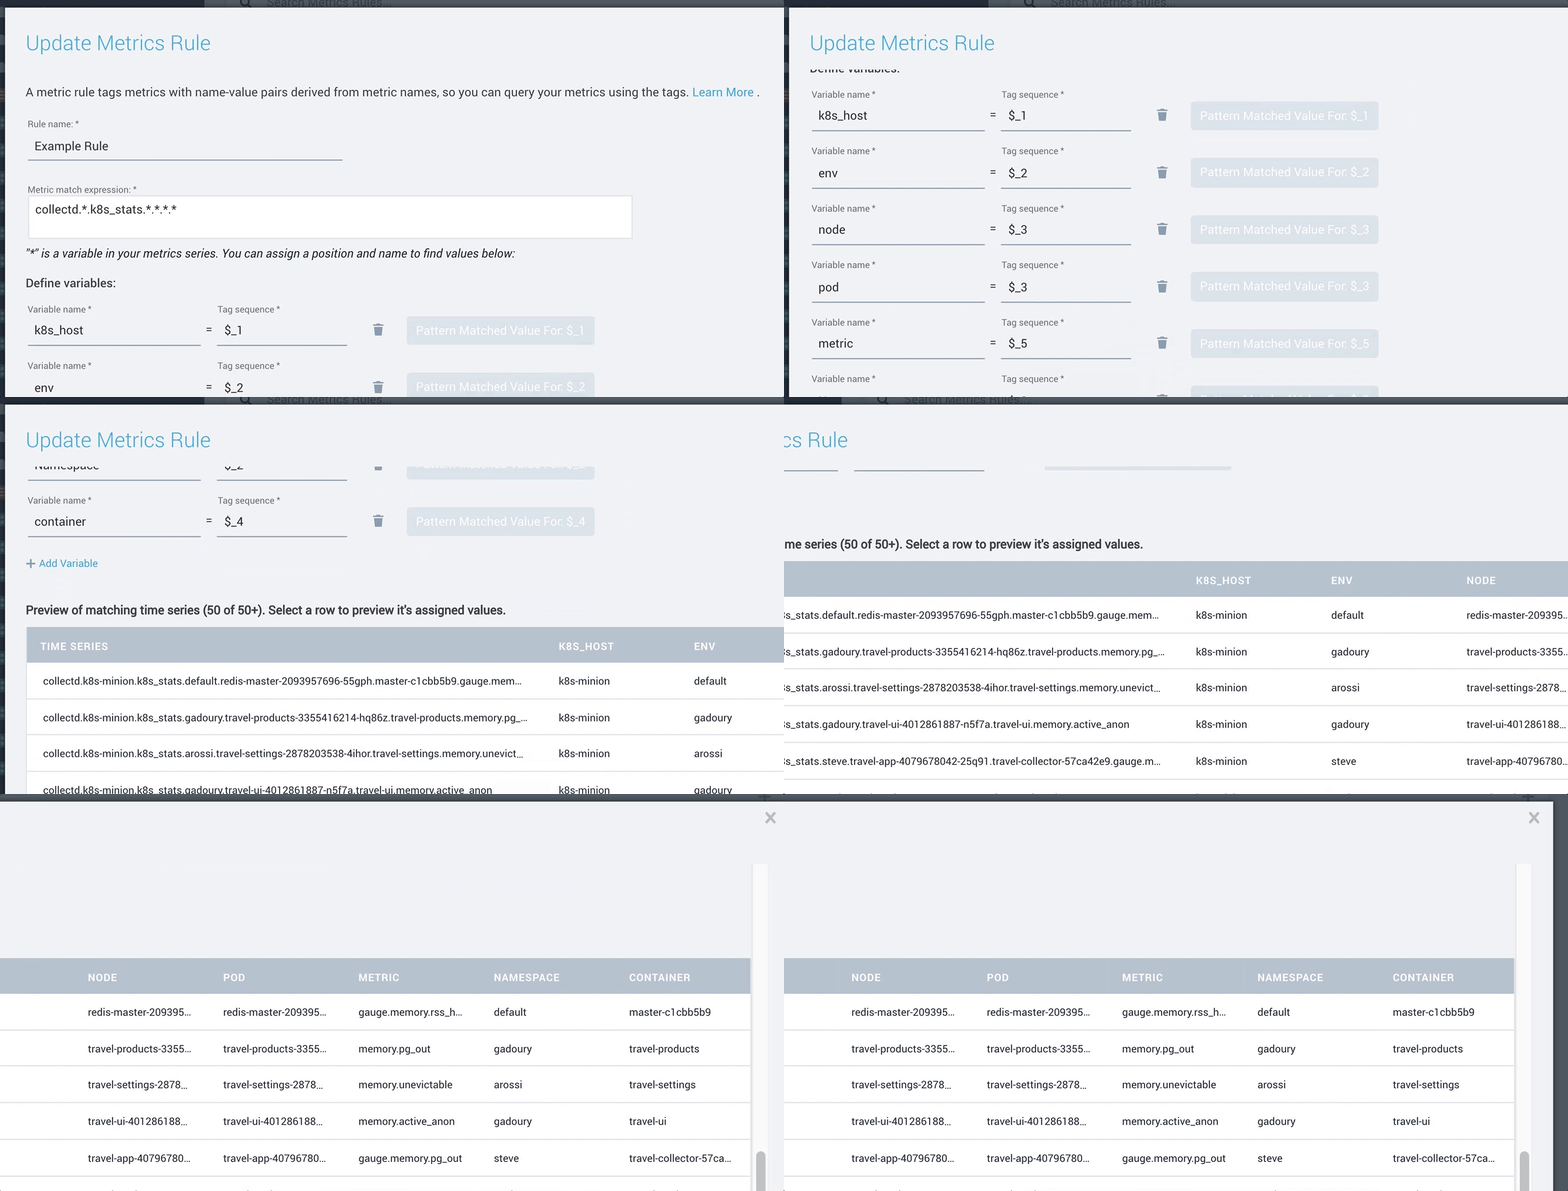
Using the example above, we can use Metrics Rules to enrich the dot-delimited Graphite names with key-value tags, which will make it easier for us to monitor metrics by our system’s logical groupings in the future:

Intuitive Metrics Rules UI for Easy Validation and Edits
As Graphite monitoring systems grow, so do the complexities in maintaining these dot-delimited hierarchies across the organization. Some teams may have defined Graphite naming schemes with five different path components (e.g., app.env.host.assembly.metric), while others may have more components or a different hierarchical definition altogether. To make it easier to create tags out of these metrics, the Metrics Rules configuration interface allows you to see a preview of your rules and make sure that you’ve properly captured the different components.

Simply specify a match expression (i.e., which metrics the rule will apply to), define variables for each of the extracted fields and then validate that each tag field is extracting the appropriate values. After saving the rule, Sumo Logic will go back in time and tag your metrics with this new metadata so you can take advantage of these rules for prior data points.
Improved Discoverability, Filtering and Alerting with Key-Value Tags
Once these metrics contain the key-value tags that we’ve applied via Metrics, you can take advantage of several usability features to make finding, visualizing and alerting on your metrics even easier. For example, Sumo Logic’s autocomplete feature makes it easier to find and group metrics based on these key-value tags:

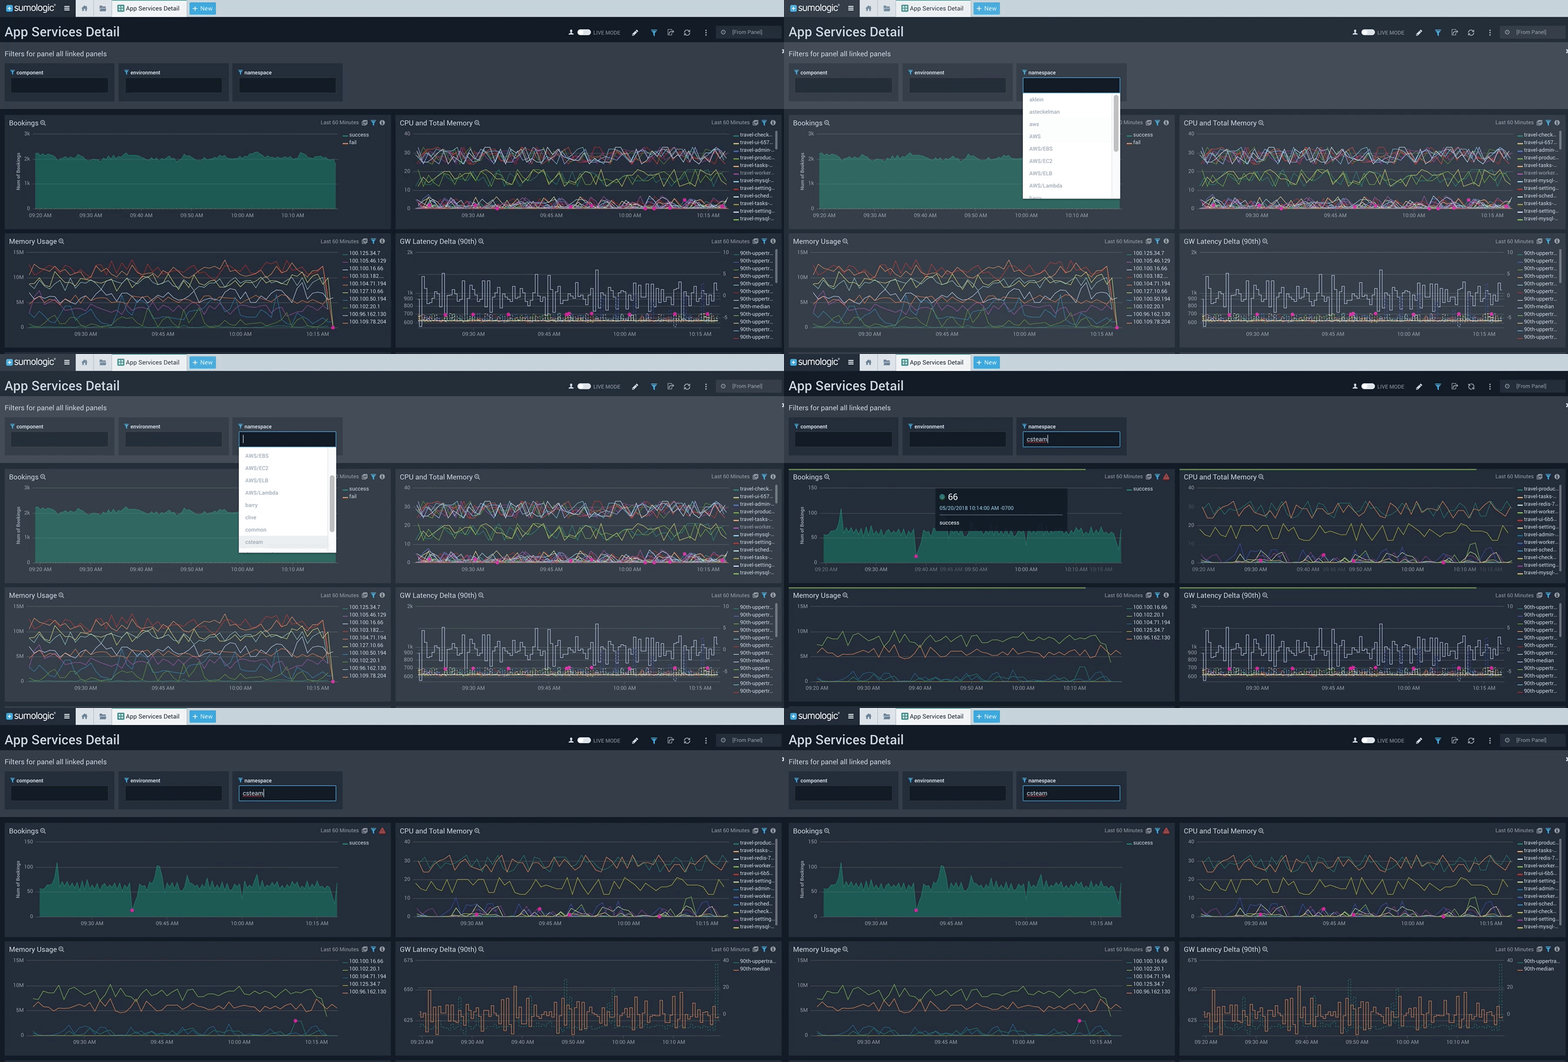
Additionally, when using our unified dashboards for logs and metrics, these new tags can be leveraged as filters for modifying visualizations. Selecting a value in one of these filters will append a key-value pair to your query and filter down to the data you’re interested in:

Finally, configuring alerts becomes significantly easier when scoping and grouping your metrics with key-value pairs. In the example below, we selected metric=vcpu.user from one of our namespaces, and we’re averaging this across each node in Namespace=csteam. This means that alerts will trigger across each node, and our email and/or webhook notifications will tell us which particular node has breached the threshold:

The Bigger Picture
Users can now convert legacy Graphite-formatted performance metrics into the metadata-rich metrics with Sumo Logic, both in real-time and after ingestion. This allows customers to increase the usability and accessibility for their analytics users by allowing them to leverage business relevant tags, instead of relying only on obscure, technical tags. Now with the capability to extract business context (metadata) from IT-focused metrics, organizations can use this data to gain actionable insight to inform strategic business decisions.
In a broader context, this is significant because as we’ve been seeing from our customers, the hard lines between IT and business are becoming blurred, and there’s a strong emphasis on using data to improve the overall end-user experience.
As more organizations continue to leverage machine data analytics to improve their security, IT and business operations, the ability to map machine data insights to actionable, contextual business analytics for IT and non-core-IT users is critical.
Learn More
Head over to Sumo Logic DocHub for more details on how to configure Metrics Rules on your account. Additionally, see how these rules can even be used for non-Graphite metrics by parsing out values from existing key-value pairs such as _sourceCategory and _sourceHost.
Are you at DockerCon 2018 at Moscone Center in San Francisco this week? We’ll be there! Stop by our booth S5 to chat with our experts, get a demo and to learn more!
Additional Resources
- Read the press release on our latest product enhancements unveiled at DockerCon
- Download the report by 451 Research & Sumo Logic to learn how machine data analytics helps organizations gain an advantage in the analytics economy
- Check out the Logs-to-Metrics blog
- Sign up for Sumo Logic for free


